Analyzing Cryptocurrency Volatility Data for Breaks, Trend Breaks and Outliers using the Indicator Saturation Method
Keywords:
Breaks, Trend breaks, Outliers, Indicator Saturation, Cryptocurrency, VolatilityAbstract
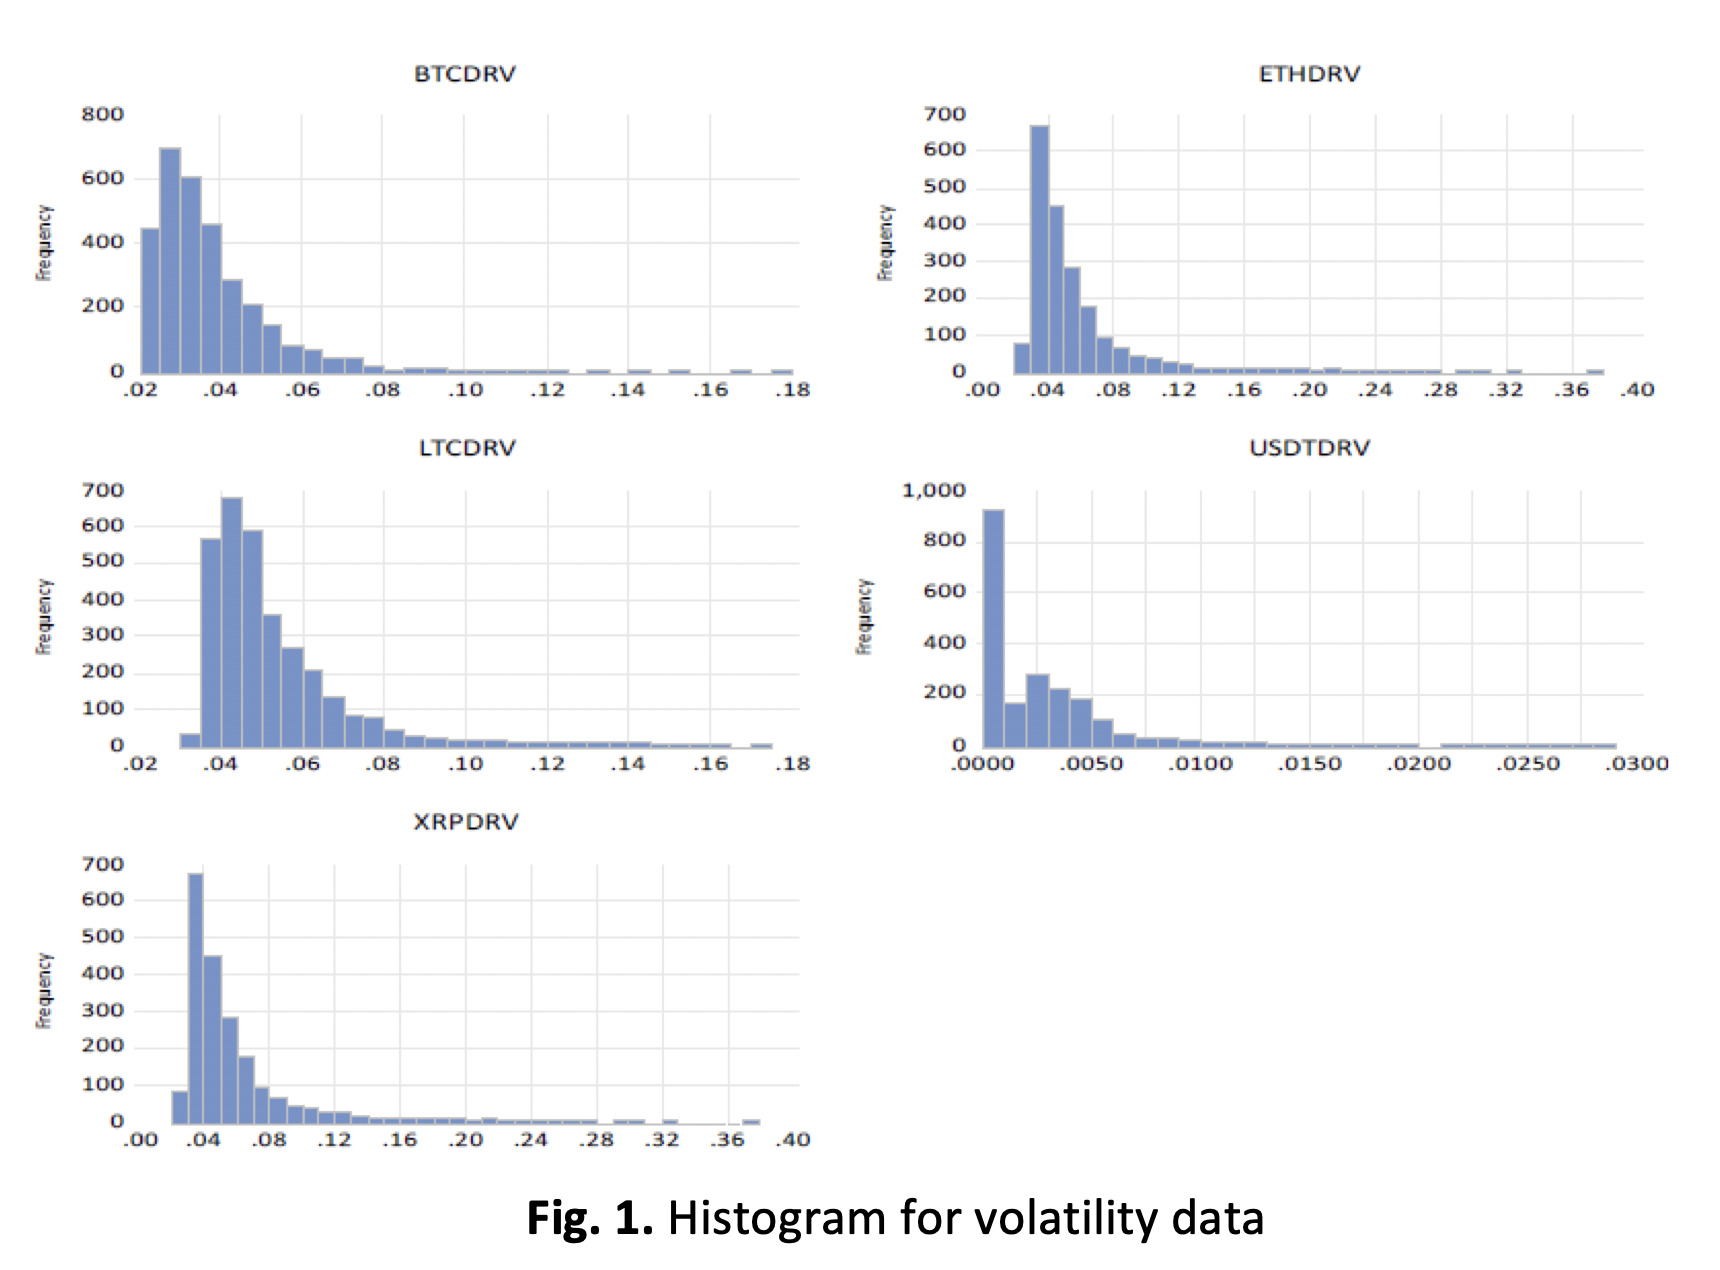
Blockchain technology sank a volatile market. Extracting volatility insights from real-time cryptocurrency price data using advanced methods is a problem that needs to be addressed. The cryptocurrency market is volatile and subject to enormous swings in value. Thus, this study examines the daily volatility of five cryptocurrency markets, including Bitcoin (BTC), Ethereum (ETH), Litecoin (LTC), Tether (USDT), and Ripple (XRP), for the last ten years. The volatility data obtained from the GARCH (1,1) model was used to identify daily breaks, trend breaks, and outliers using the indicator saturation (IS) method. The IS method identified a total of 24 outliers, 91 structural breaks, and 305 trend breaks across the cryptocurrency volatility data over the last decade. Of which BTC had 111 daily breaks, trend breaks, and outliers, compared to LTC's 101, ETH's 74, XRP's 71, and USDT's 63. Fluctuations occurred each year, mostly in 2017, 2018, 2020, and 2021, due to legal uncertainty, security issues, and initial coin offers (ICOs). The COVID-19 pandemic in 2020 also caused economic uncertainty and increased volatility. These findings can aid in improving volatility models by comprehending how various events affect financial markets. Authorities and decision-makers may also ensure financial stability. This study sheds light on how future money and virtual currencies may affect financial technology. Our analysis shows that the market has been risky for a decade.
Downloads